Your own database
Every account gets a separate database file. Your sessions, check-ins and notes are never stored in the same file as anyone else's.
RPE-based training journal
After each session, rate how hard it was. Training Journal turns effort × minutes into your training load, fitness, fatigue and recovery, for swimming, cycling, running and strength. It needs no power meter or heart-rate strap, and your journal isn't shared with anyone.
Every account gets a separate database file. Your sessions, check-ins and notes are never stored in the same file as anyone else's.
No ads, no analytics, no third-party scripts, and even the fonts are served from our own server. The only cookie keeps you signed in.
The server runs at Infomaniak in Switzerland. Your email address is used only to sign in and recover your account, never for marketing.
Download everything as one file at any time. Deleting your account removes your journal and your backups from the server for good.
How it works
Drag sessions onto the calendar, reuse templates, and give each week of the season a phase and a target in hours.
When you finish, log the minutes and an RPE from 1 to 10. Sixty minutes at RPE 5 is 300 points of load, whatever the sport.
Four quick sliders for sleep, fatigue, stress and soreness. The dashboard compares them with what's normal for you.
Calendar
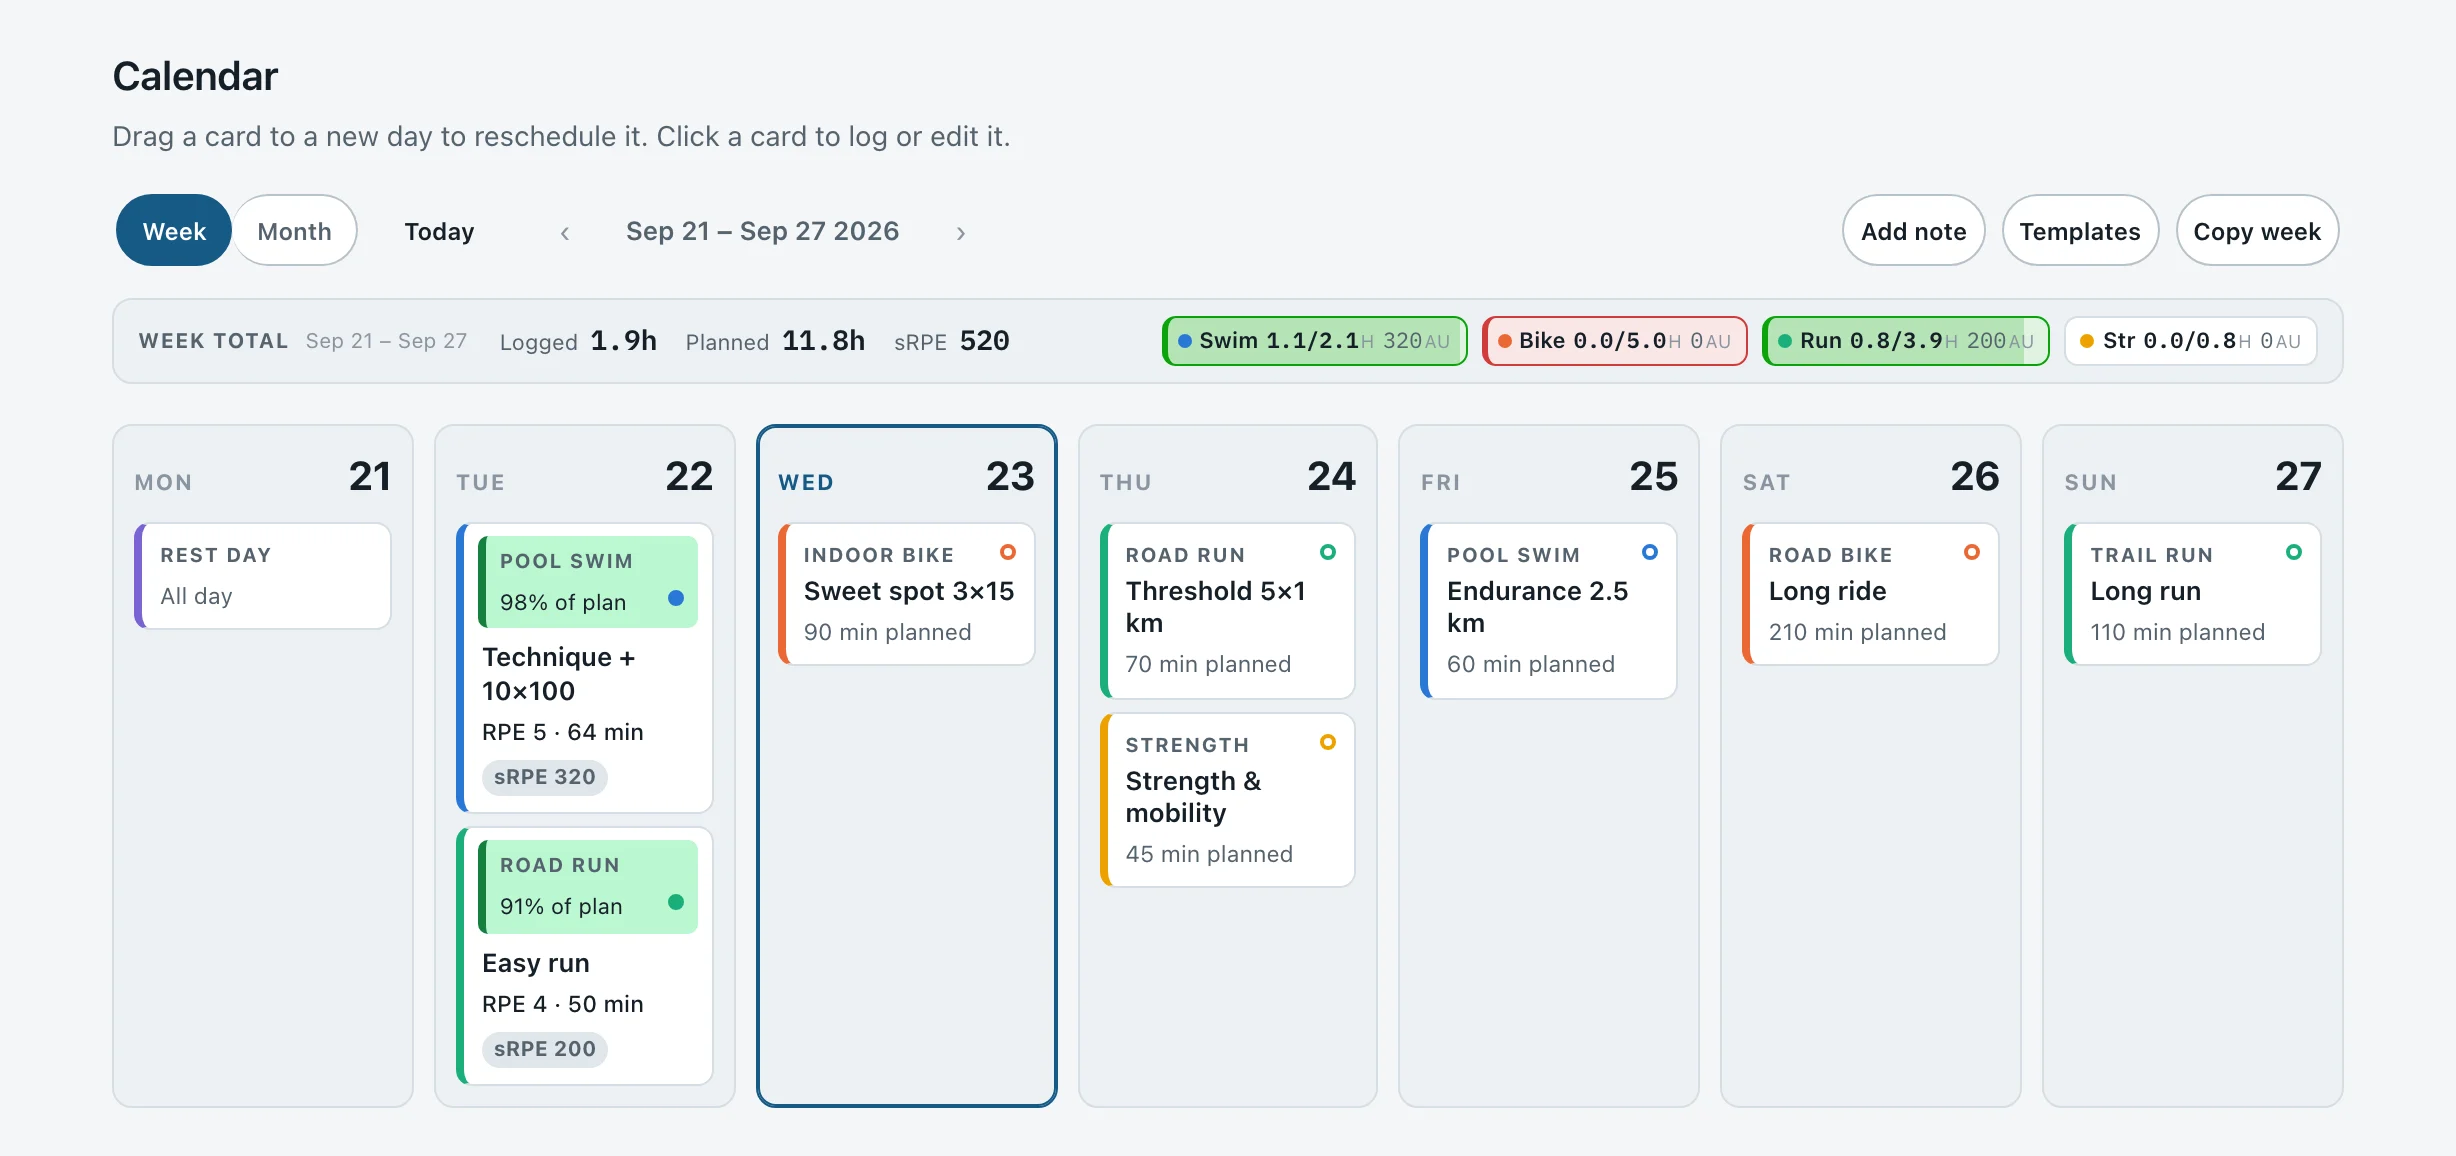
Every session shows its RPE, minutes and load, and how close it came to the plan. Drag a card to another day to reschedule it. The week's totals per sport sit right above the board.
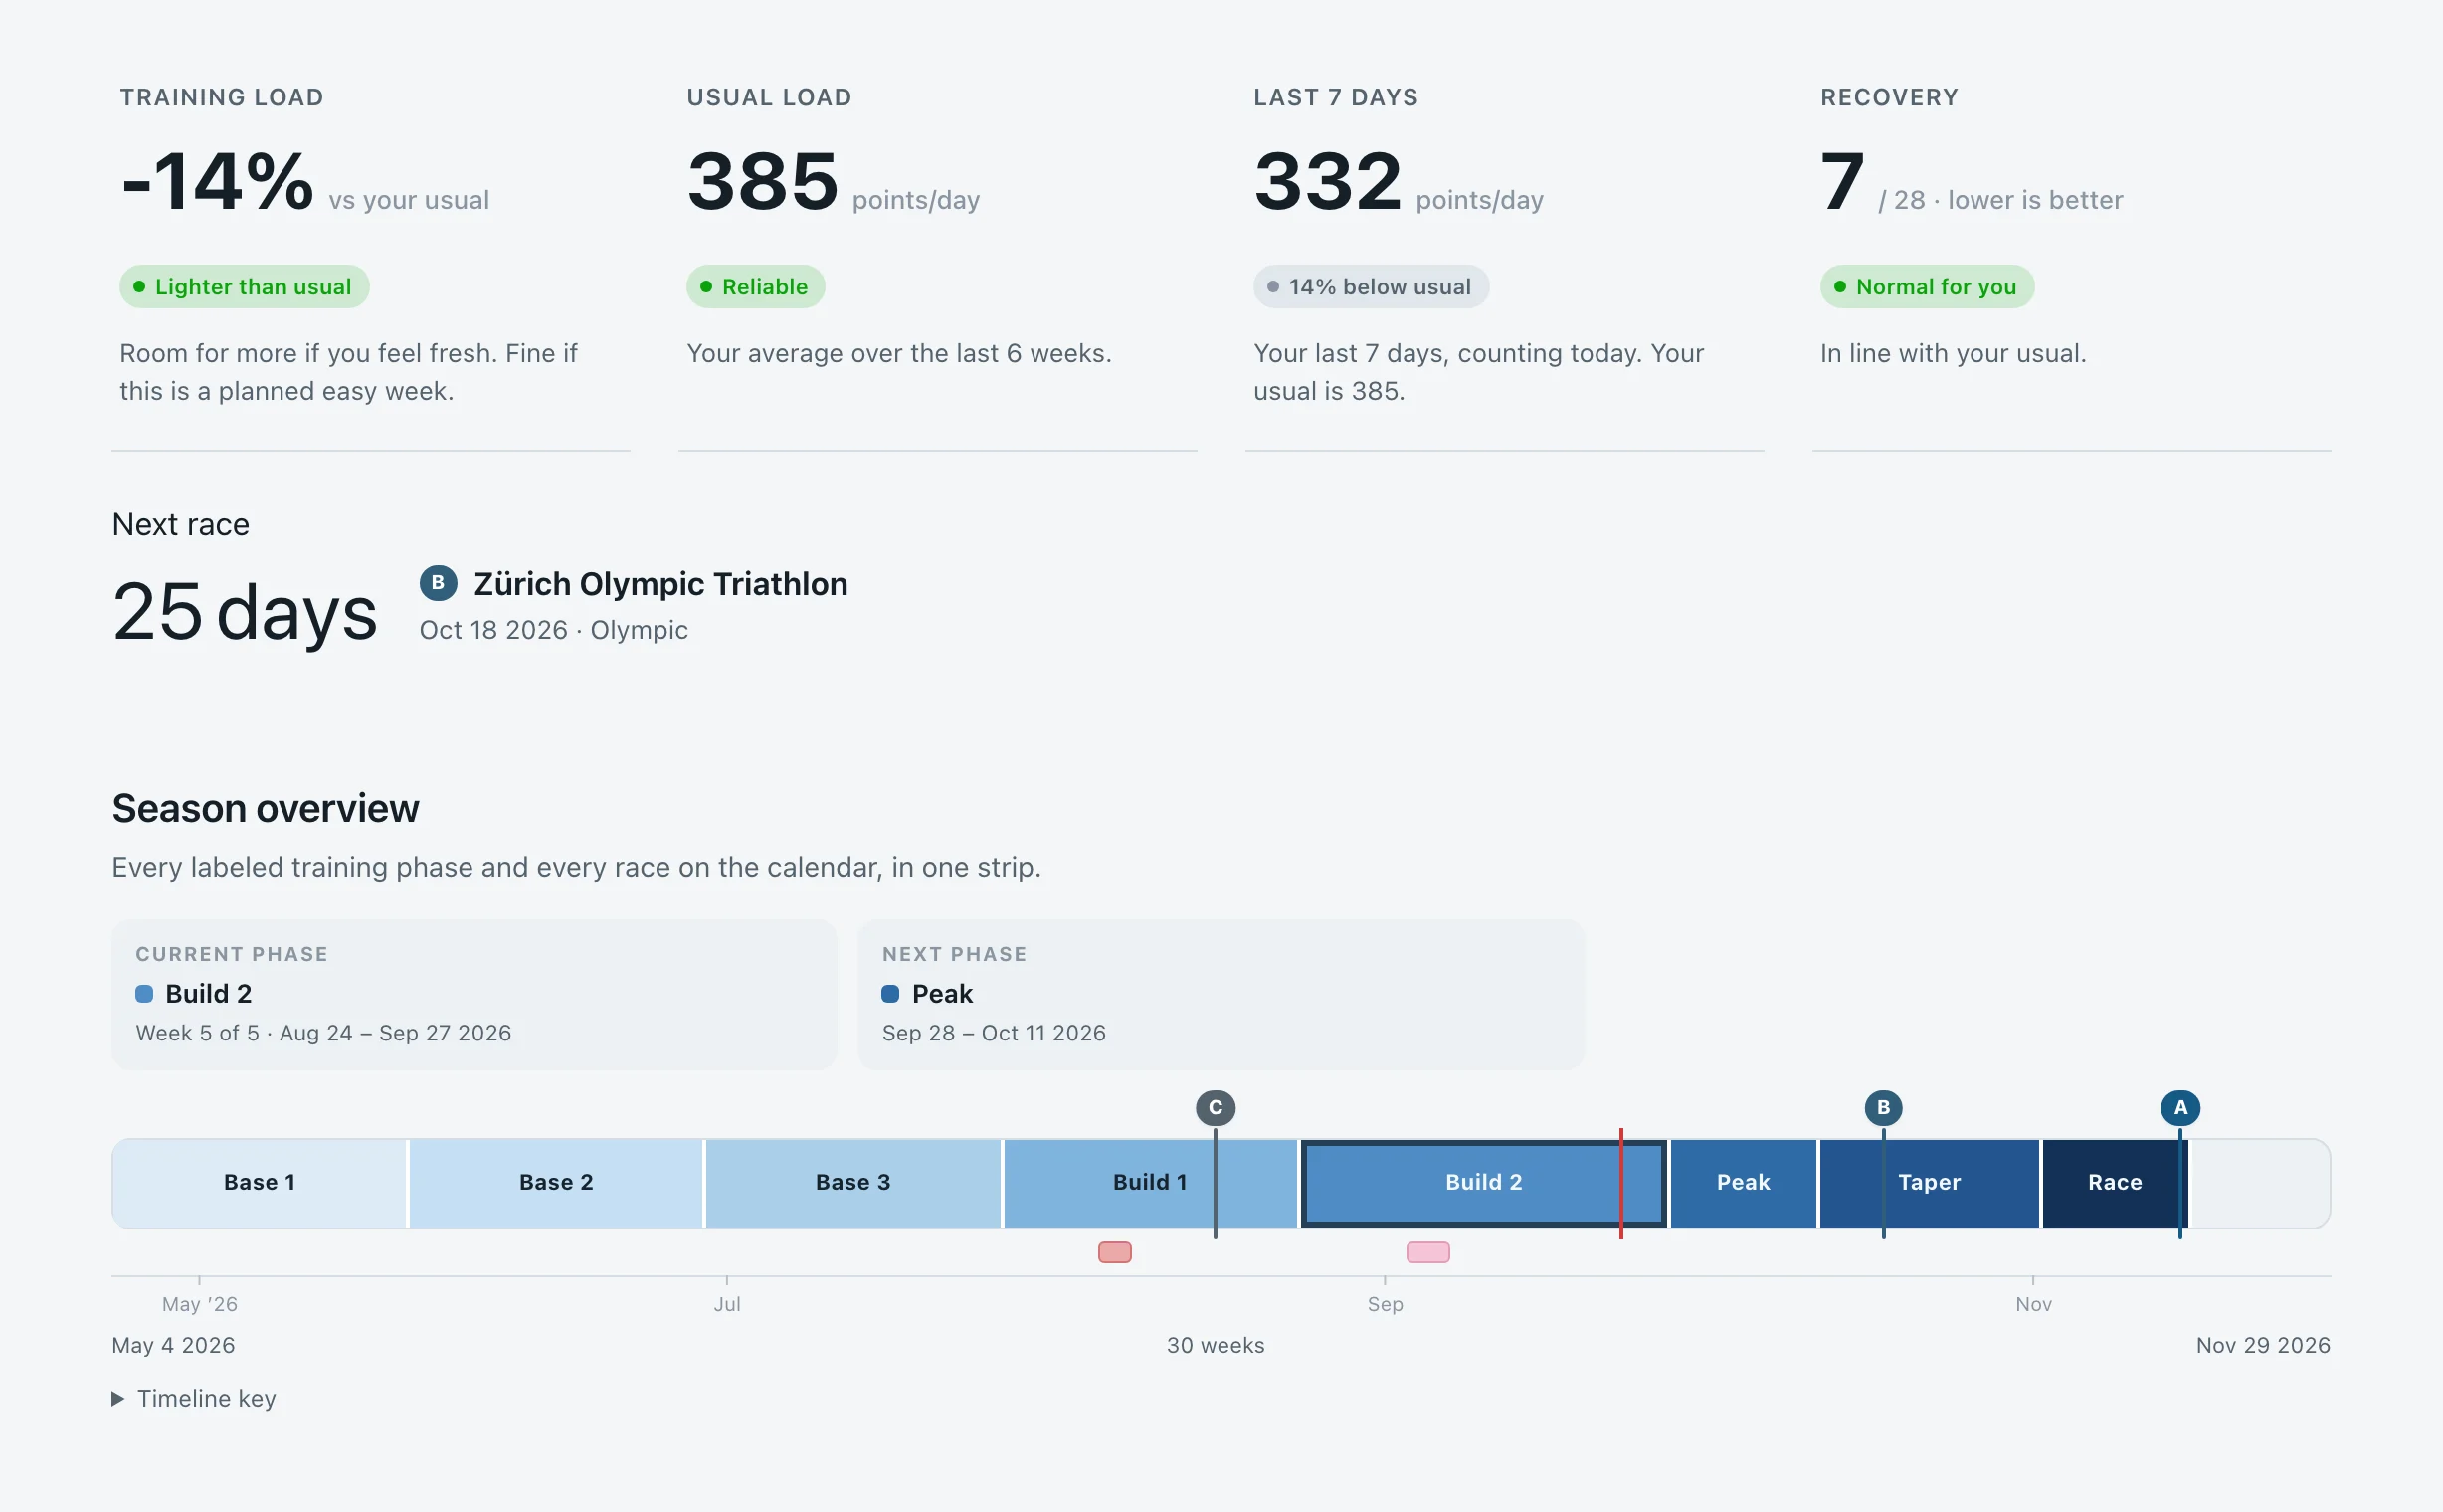
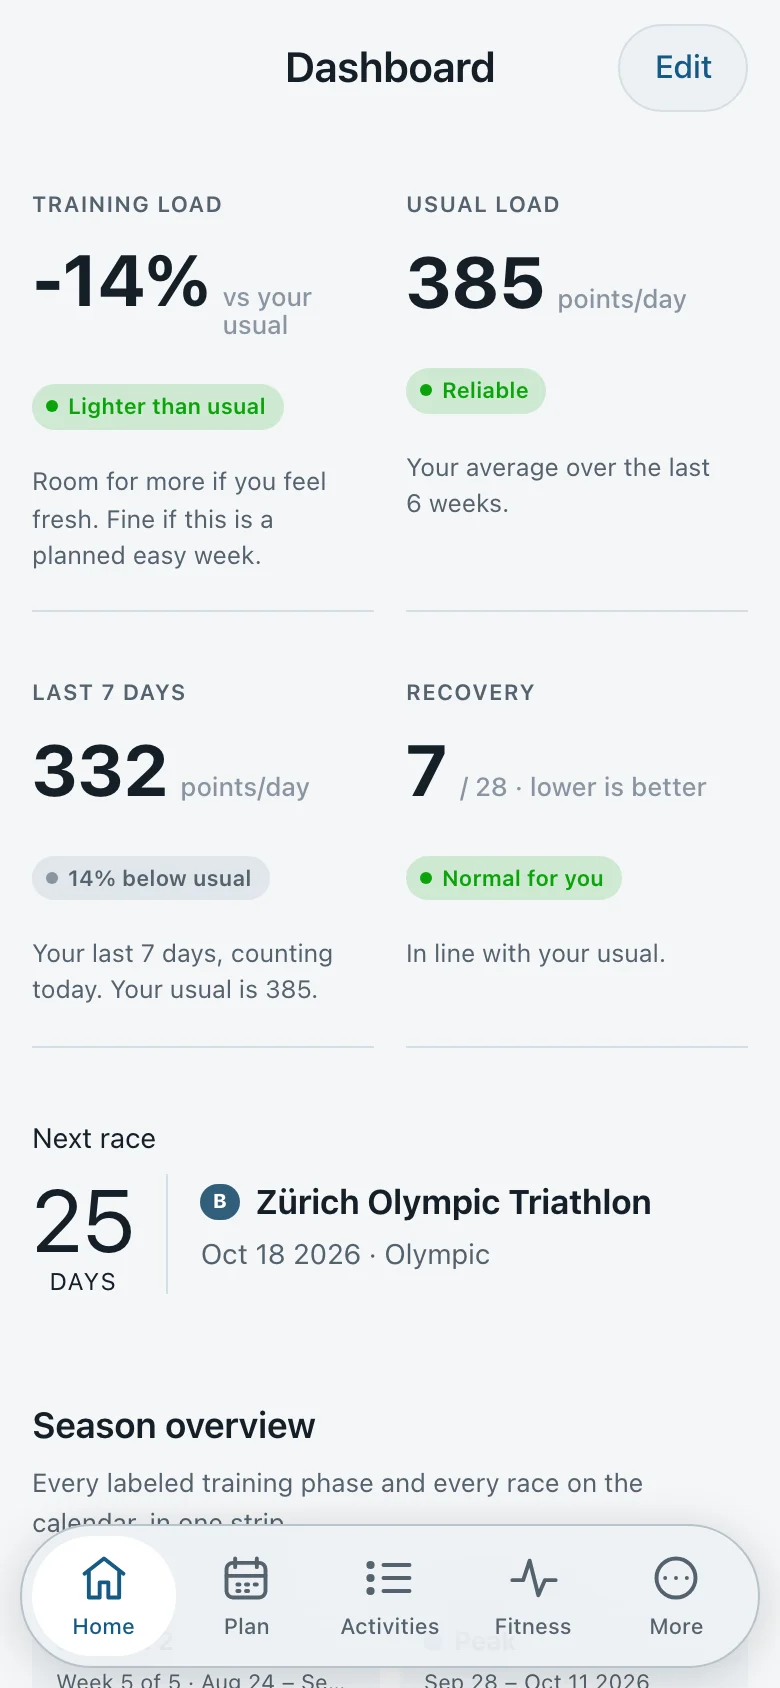
The dashboard sums it up in plain words: heavier or lighter than usual, and how you're recovering, measured against your own history rather than a textbook.
Fitness
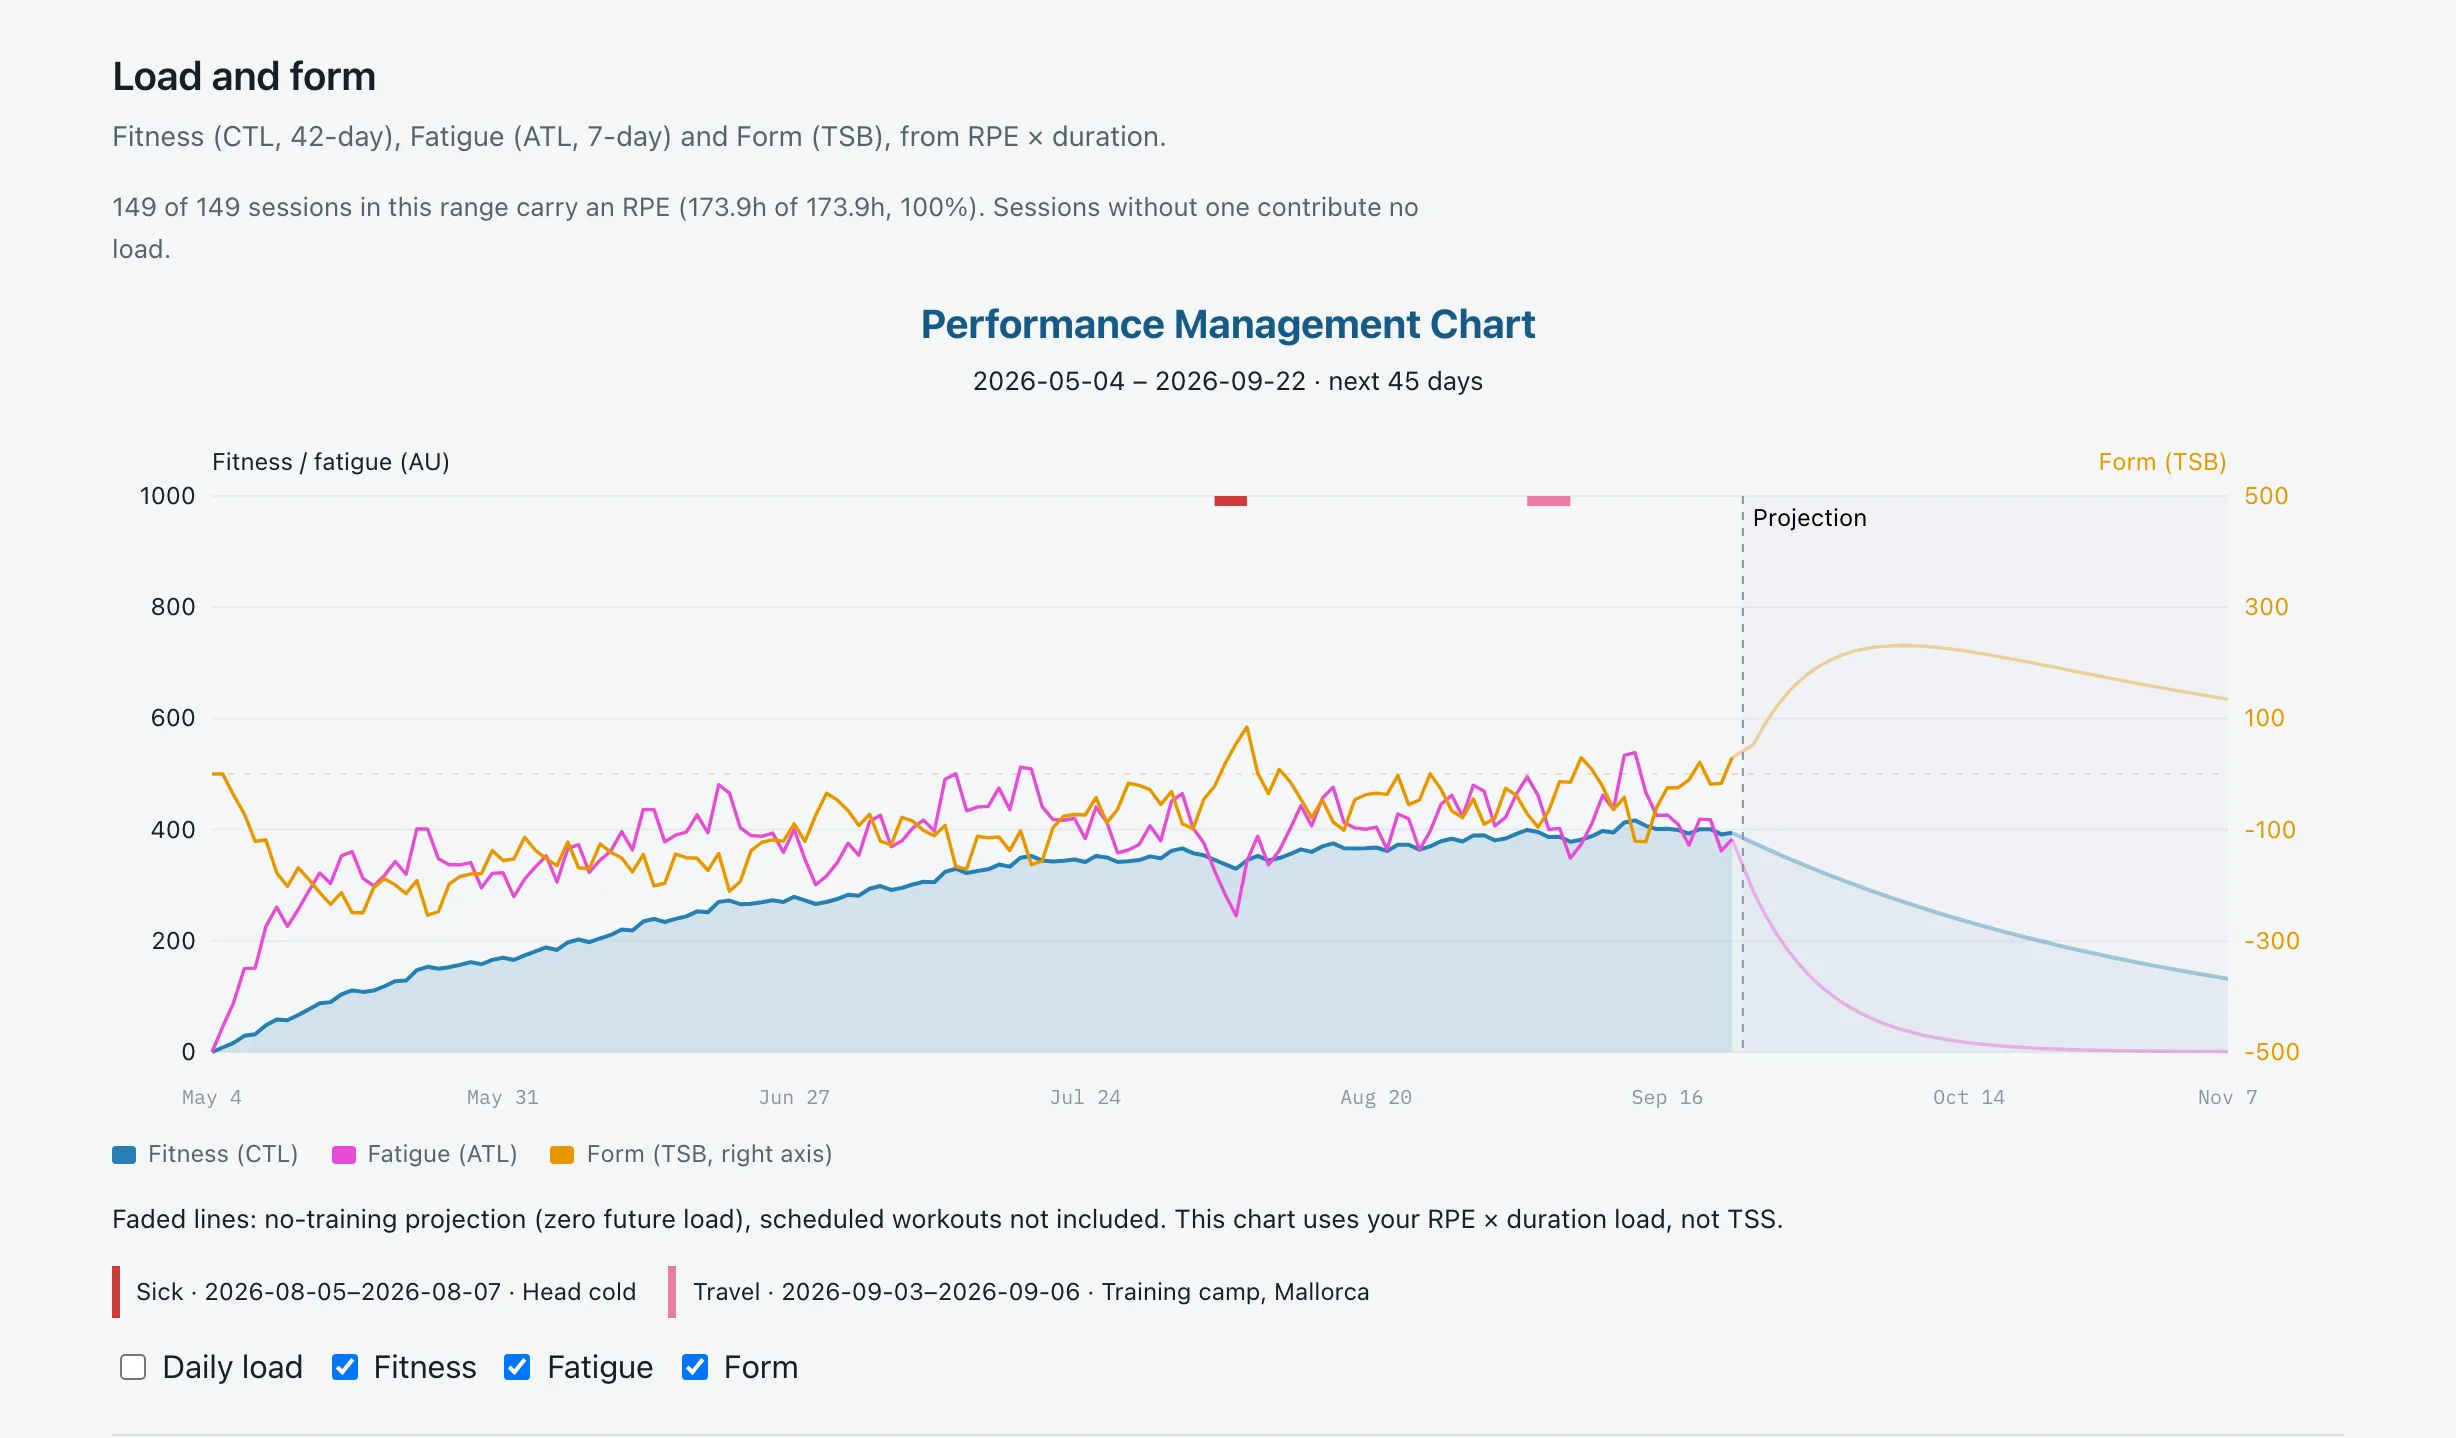
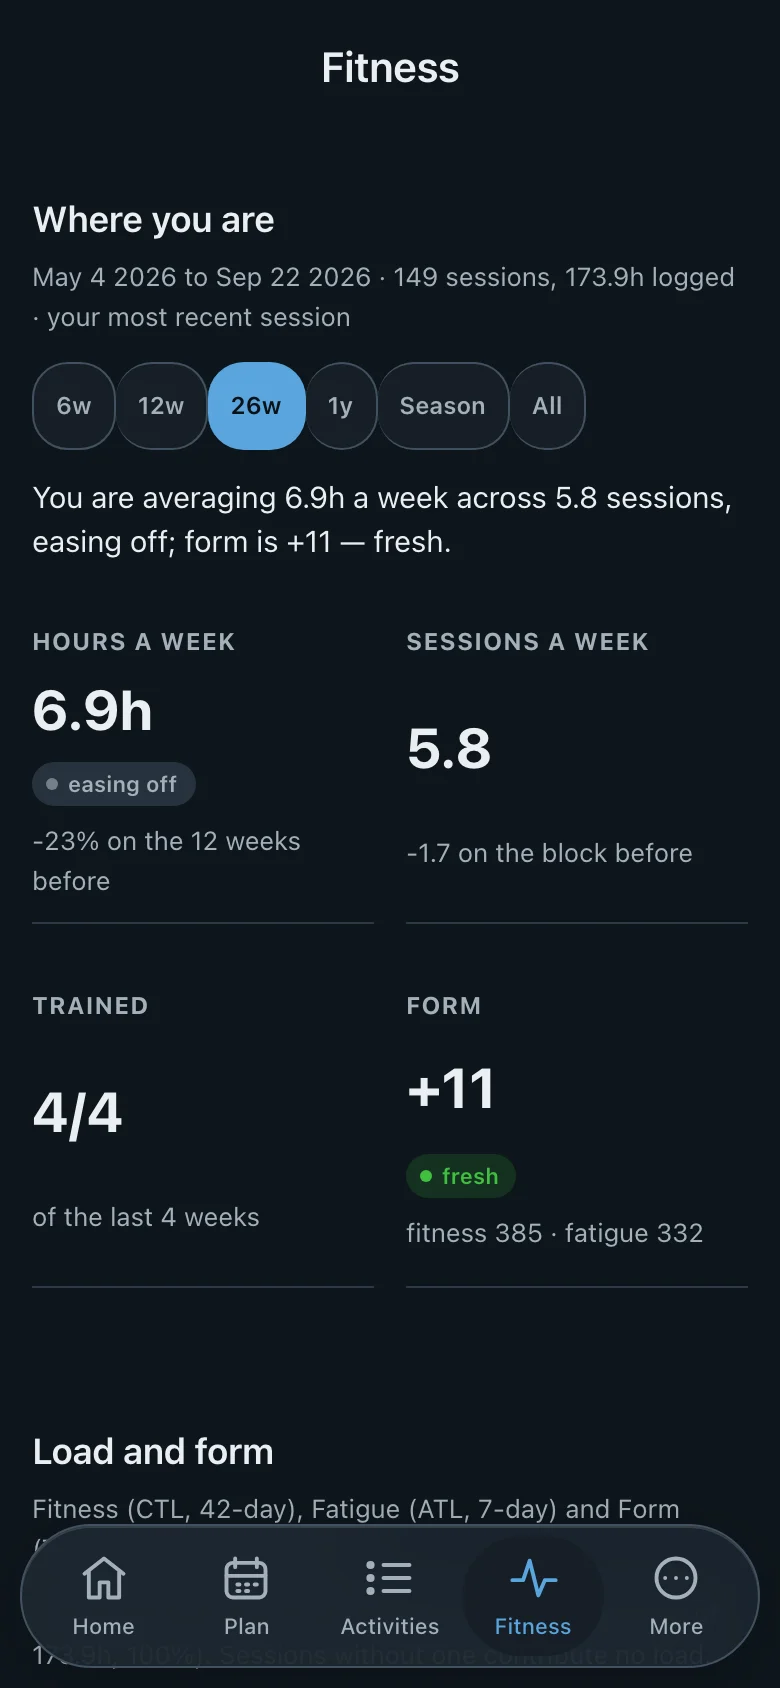
Fitness, fatigue and form are worked out from the RPE you already log, with the days you were sick or travelling marked on the chart. Guardrails flag a ramp that's too steep or a week that's too samey, before it catches up with you.
Season plan
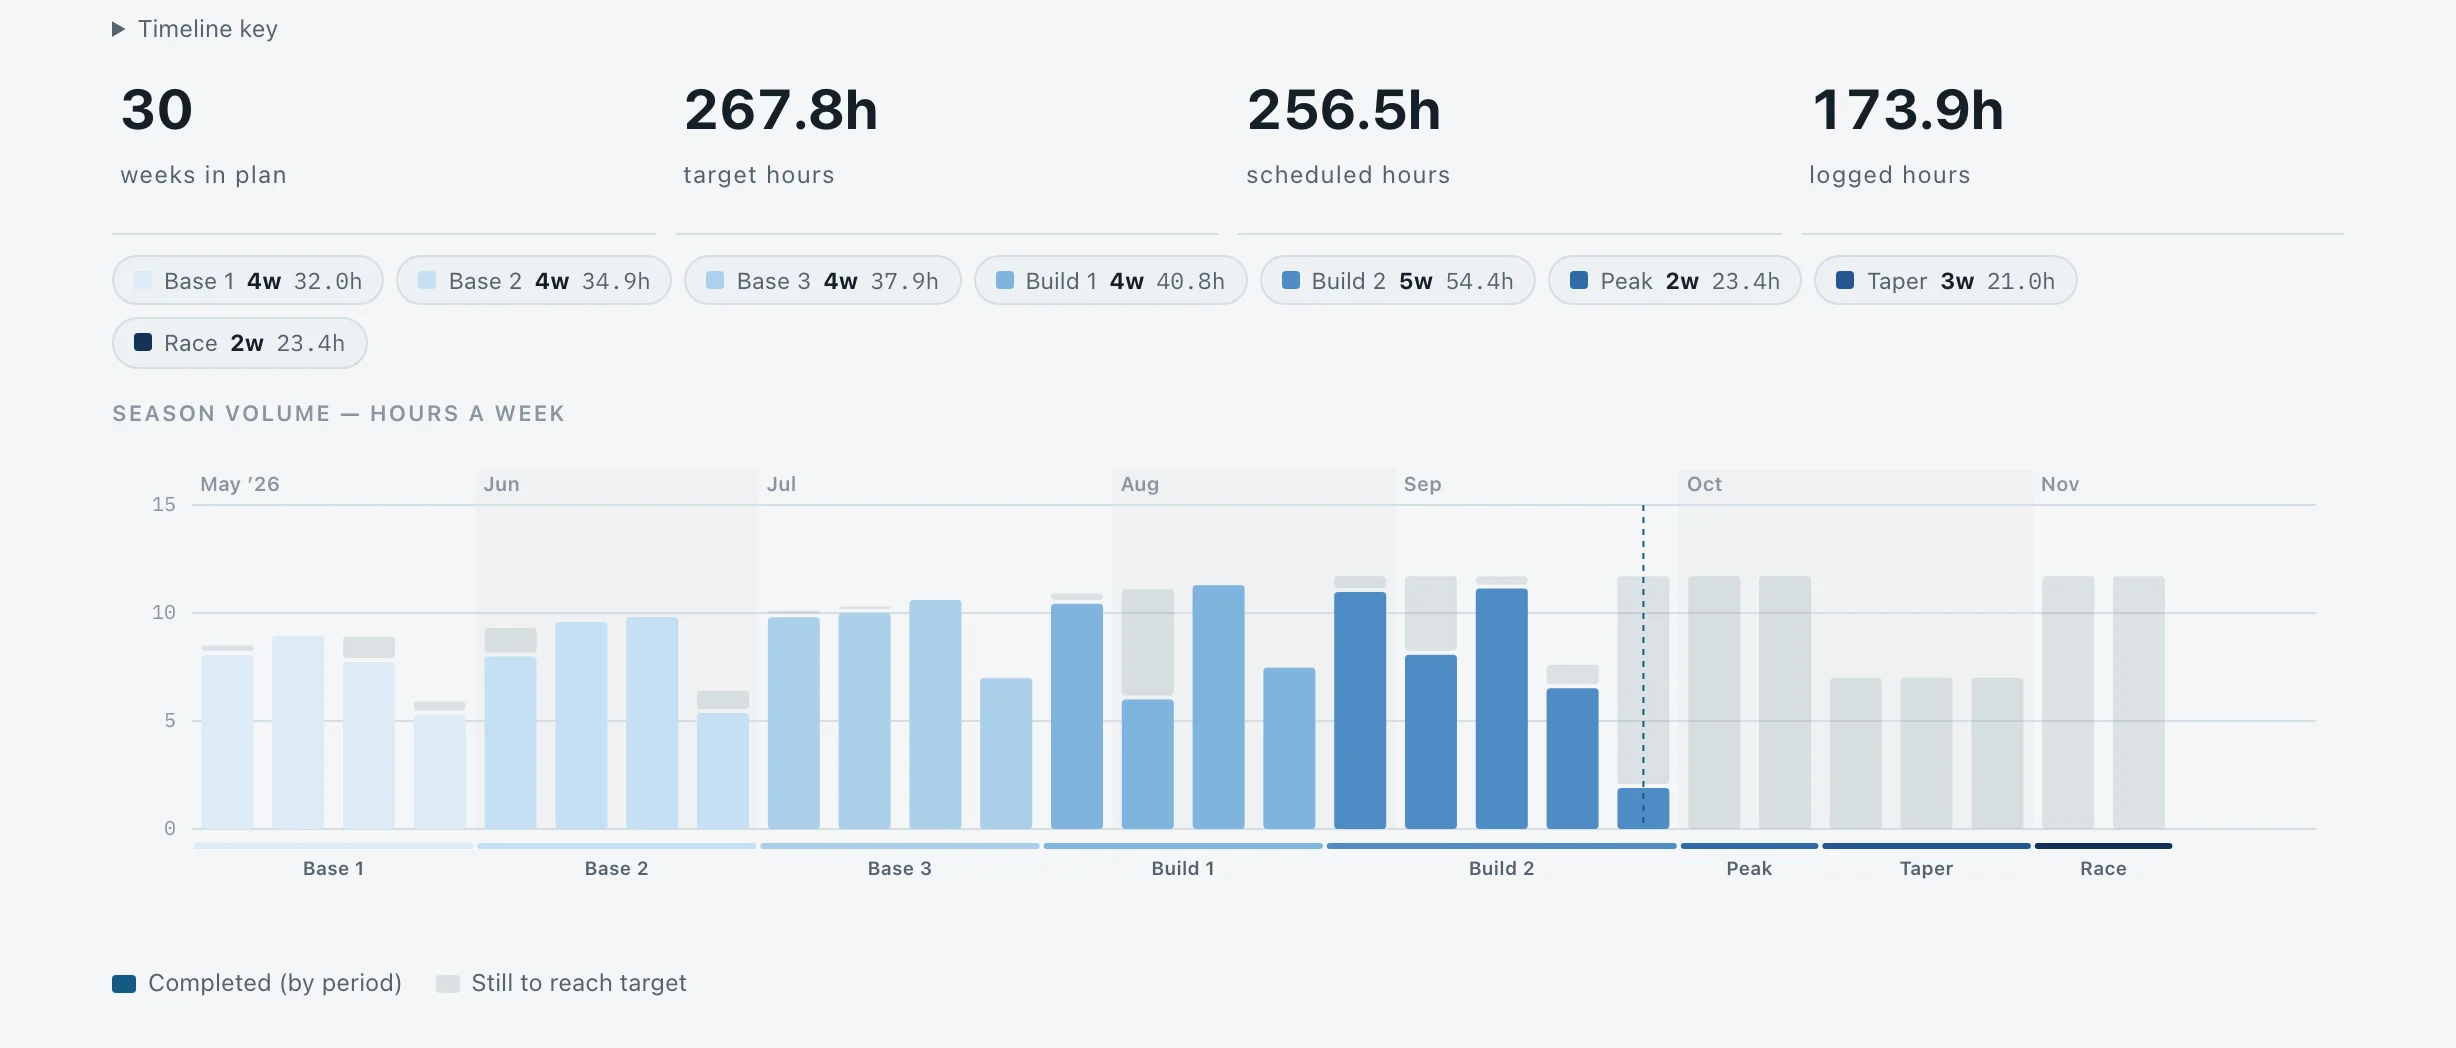
Lay out base, build, peak and taper week by week, add A, B and C races with goal times, and compare the hours you planned with the hours you logged. Nothing is generated for you: it's your plan.
Everywhere
Add it to your home screen and it works like an app, in light or dark mode. Changes you make without a signal are kept and sent once you're back online. An optional daily reminder nudges you to check in.
Set up in a minute. All you need is an email address to confirm your account.
Create your account